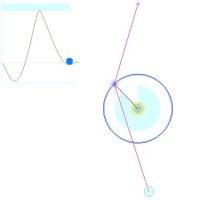
Move with the mouse the red marker and watch what happens.
Applet information: Based on an applet of
L. Griebl. Modifications (mostly eyecandy
and change of geometry) by Oliver Knill, 2000. An angle sector visualization
was added in July 2005.
|
The Zeeman catastrophe machine illustrates that discontinuities can occur naturally
also in completely smooth setups.
The mouse position (x,y) determines the wheel angle z=f(x,y).
The graph to the left shows the potential energy V(x,y,z) depending on
the mouse pointer (x,y) and the angle z. The function z=f(x,y) is determined by
the property that the partial derivative g(x,y,z) = Vz(x,y,z) is zero.
The interpretation is that the wheel angle z settels so that the potential energy is
a local minimum. For fixed (x,y), the function h(z) = g(x,y,z) has
different minima in general as you can see when watching the graph of h in the applet.
The value f(x,y) choses a local minimal energy configuration. But if a local minimum disappears,
the next local minimum can be far away and the angle can jump. Again: while the angle z
is always on the smooth surface g(x,y,z) = 0, the function f(x,y) is discontinuous.
Discontinuities are also called catastrophes.
|