Mathematica Project, Math21b Spring 2008
Oliver Knill, Harvard University, Spring 2008
Support
Welcome to the Mathematica computer project! In case problems with this assignment, please email Oliver at math21b@fas.harvard.edu. Mathematica can demand a lot of resources from computers. Therefore, save the notebook frequently during your work. The actual assignments are in the last blue box of this notebook. This lab is due at the last lecture of the semester. You will have to print out the assignment part with your solutions and hand them in. All problems are listed at the end. Turn in 3 of the 5 problems to get full credit. All problems have sample code in this notebook somewhere. The total work should be minimal. It can be done in a 2-3 hours if you are in a hurry. If you think you need too much time, network around or ask. This project is not intended to take a large amount of time. Check the syllabus to remind yourself how the lab is used for your grade.
Cells and Expressions
The notebook is subdivided into cells, bounded by a blue bracket. This is a "text" cell, the next is an "input" cell. We compute the dot product of two vectors:
![]()
To evalute an expression, click anywhere on the expresson, hold down the <Shift> key and press <Enter>. This is how we compute the inverse of a matrix:
![]()
In this notebook, input cells are boxed in green for better readability.
Basic Computations
Mathematica allows to work with vectors and matrices in the same way as with numbers. A dot . is the matrix multiplication or dot product. The following examples should be selfexplanatory.
![]()
![]()
![]()
![]()
![]()
![]()
![]()
Eigenvalues
With Eigenvalues[A], we can compute the eigenvalues, with Eigensystem[A], both the eigenvalues and the eigenvectors. What happens for a random matrix? Here, we plot the complex eigenvalues of a random 50x50 matrix. You might want to try with larger matrices to see a pattern.
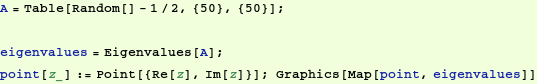
Explore this for larger and larger matrices. What do you observe?
An other question. Sergey Sadov of the Memorial university in Canada asked: Suppose A is an NxN matrix with entries independently and uniformly distributed on[0, 1].What is the distribution of the absolute value of the largest eigenvalues of A for large N?
![]()
Lets do an experiment, take 1000 matrices, compute the largest eigenvalue in each case and look at the distribution. This computation takes some time.
![]()
If we plot these data, we see the distribution function:
![]()
The density function can be visualized as follows:
![]()
While we are at it, lets also compute some statistical properties:
![]()
Determinants
What is the distribution of the determinant of a random matrix? To see the distribution of a random 10x10 matrix, lets do 100 experiments and plot the results in a sorted manner.
![]()
This distribution approaces the arcsin distribution.
![]()
Here is how we compute the determinant of the 100 x 100 matrix which contains the entry i*j at the entry (i,j).
![]()
Differential Equations
Differential equations can be solved with the command "DSolve". Here is an example, where one does not specify the initial conditions:
![]()
Here is an example, where the initial conditions are specified. This is the solution of the forced driven harmonic oscillator:
![]()
![]()
Markov Processes
A vector is called a probability vector if each entry is nonnegative and the sum of all its entry is 1. A matrix A for which each column is a probability vector is called a Markov matrix or stochastic matrix.
![]()
A Markov matrix has an eigenvalue 1 because its transpose has the eigenvector [1,1,..., 1]. The eigenvector of the eigenvalue 1 of A is called the steady state.
![]()
When iterating the matrix A, it converges to a matrix which has the eigenvector as column vectors.
![]()
Here is a magical square:
![]()
If we divide it by the sum 65 over each column, we obtain a stochastic matrix.
Products of random matrices
If we multiply random 2x2 matrices, how fast does the product grow? The answer depends on the size of the random numbers. Lets take random numbers between -c and c:
![]()
![]()
For which range of c, does the product appear to grow exponentially?
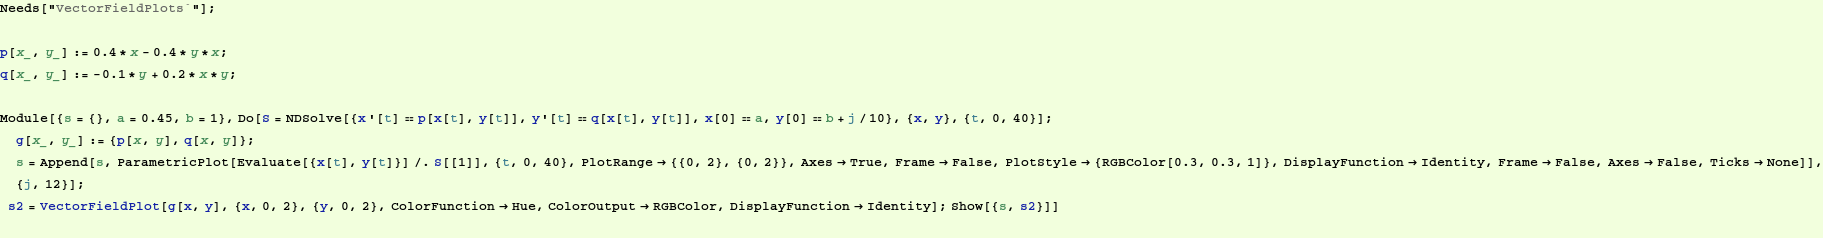
Nonlinear Systems
Here is an example, of how to plot a phase portrait of a nonlinear system. It is a Volterra system which is a model in population dynamics.
Fourier Series
Lets compute some Fourier series. In this example, we compute the series of an odd function so that we only have to compute the sin-series.
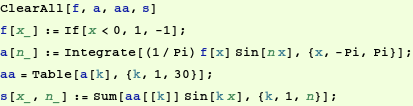
For every n, we have a Function s[x,n] which is a Fourier approximation of the function f:
![]()
If you plot several plots, you observe that while the Fourier approximation converges pointwise, there is an overshoot near the discontinuity. This is called the Gibbs phenomenon.
![]()
Partial Differential Equations
Here is how Mathematica can solve a partial differential equation. Here it is the wave equation. The result will be given in terms of variables C[1],C[2] which can be general functions:
![]()
Note that the solution capabilities of Mathematica are rather limited in partial differential equations.
Here is a numerical computation of the one dimensional wave equation with inhomogeneous right hand side on the unit interval with boundary conditions zero at 0 and 1.
![]()
Sound and Fourier
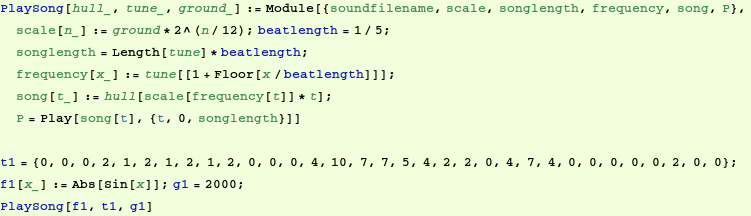
Instead plotting a function, you can also play it. A song is just a function.
![]()
If you superimpose several functions, you can hear several "melodies" together.
![]()
You can export it as a Wave file and use it as a cellphone ring tone ....
![]()
The smoothness of a function depends on how nice it sounds. A discontinuous function sounds horrible. The fourier series decays slowely.
![]()
Sound generation
Here is how you can play a tune with Mathematica with a given wave form. In the example below, we take the Sin function as the wave form and play a tune.
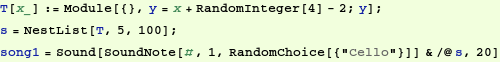
Random music
Lets play some random tune:
You can export this into a midi file:
![]()
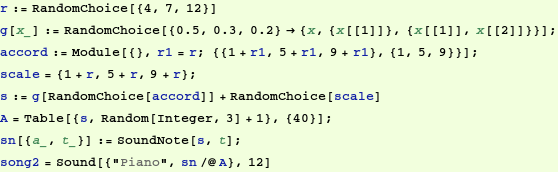
here is an example with random accords. We also change time randomly.
![]()
In the