Math 21a, Fall 2008
Exhibits page Math 21a 2008, Multivariable Calculus
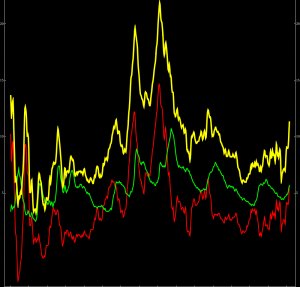
The misery index
Course head: Oliver Knill
Office: SciCtr 434
Email: knill@math.harvard.edu
Here are the "misery index" slides mentioned in
the intro meeting of Tuesday Sep 16. The story
illustrates that multivariable calculus concepts can be useful to visualize
data. The example is a
NYT article by Floyd Norris of September 13, 2008
titled "The return of the misery index".
Links: 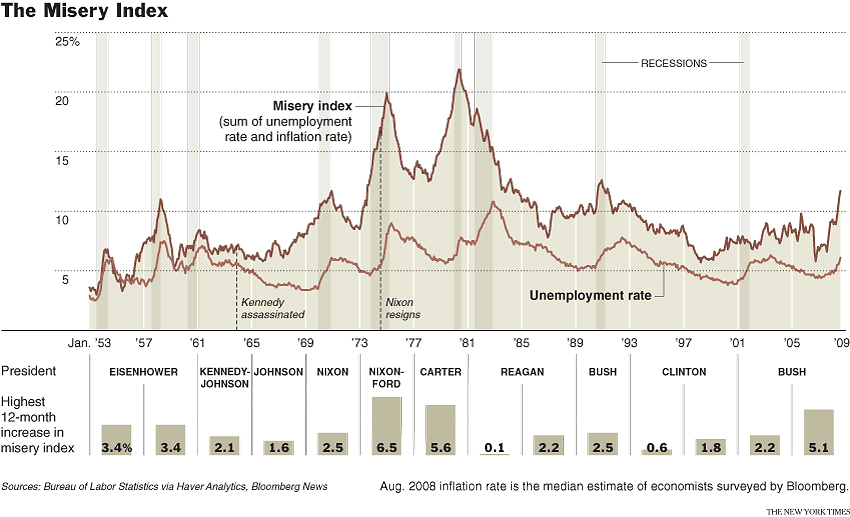 The NYT Chart |